Multimodal Projects & Digital Composition Tools
This page provides information and resources for teaching multimodality in the composition classroom. While the focus of this page is on fresh ideas for new digital tools and revamped multimodal projects, you can also navigate to the Traditional Multimodal Projects section for information on infographics and research posters.
Table of Contents:
Digital Tools
Implementing Digital Tools with Multimodal Projects
Traditional Multimodal Projects
Digital Tools
Litmaps
Litmaps is a research visualization tool with an array of uses:

- It can help students find new sources via its database of articles
- It allows for source annotation, meaning that students could potentially create an interactive annotated bibliography in this program and share the link to their project with the instructor for review/grading.
- It can make connections between sources using the "seed map" function, which autogenerates a map of all texts that cite and are cited by a single article.
- The visual mapping feature literalizes the phrase "mapping the conversation." For visual learners, Litmaps could help students understand the web of conversation at play surrounding any given topic.
Litmaps requires that users sign up with an email address and password, but it does have a robust free version, so students do not have to pay.
The program was created with the sciences in mind, but its database retrieves a wide selection of articles from all disciplines. Though the program is generally used by grad students and researchers, it could be a fresh addition to an ICaP classroom to show students different types of information sharing and digital composition.
You can use this tool to have students create a visual, interactive annotated bibliography. See the Multimodal Assignments Using Digital Tools section below for more information on how to apply this tool.
Try out Litmaps here.
Scroll down or click here for assignment ideas using this tool.
Google Sites
Google Sites is a simple website building tool that integrates with Google Drive, Docs, Slides, Forms, etc. That means that students can easily embed a pdf or Word doc directly into their website with no coding or image hosting hassles. Students can directly type or copy-and-paste text or an image into the WYSIWYG editing interface.
This program allows students to practice visual design and digital composition practices through choosing the layout, color schemes, and content of their site.
A note on privacy: if students are concerned about the privacy of their work, they can choose not to publish their site. Instead, they can share the link to their unpublished site with you for review and grading. Students who do publish their site can choose an option that bars their site from showing up in search engines, which means that only those who have the link to the site will be able to view it.
You can use this tool to have students create a digital research portfolio or their end-of-semester final ICaP portfolio. See the Multimodal Assignments Using Digital Tools section below for more information on how to apply this tool.
Try out Google Sites here.
Scroll down or click here for assignment ideas using this tool.
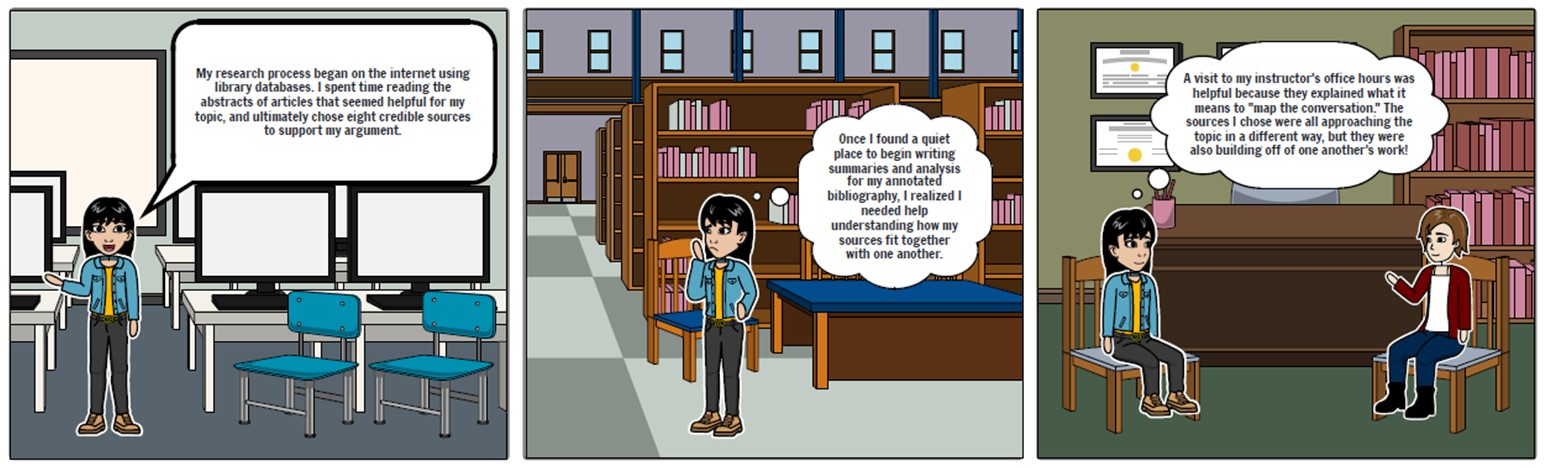
Storyboardthat
Storyboardthat is an online storyboarding program that allows users to create comicstrip-style images.
Free Version Access:
- Students can create up to two storyboards per week
- Two free sizes available: 3 or 6 slides
- Accessible, easy-to-navigate menu system
Features:
- A variety of scenes and character models – accommodates diverse remediation topics
- Some topics, such as “Science,” are separated out for easy access
- Search functionality and filters
- Speech bubbles and text entry
- Shapes and infographic-style design elements
You can use this tool for remediation assignments. See the Multimodal Assignments Using Digital Tools section below for more information on how to apply this tool.
Try Storyboardthat here.
Scroll down or click here for assignment ideas using this tool.
QR Codes
Students can create QR codes that direct viewers from a print component to a digital component of their work using a QR code.
Two ways to generate a QR code for free:
- Generate a QR code with the QR Code Generator.
- Using the Google Chrome browser on a laptop or desktop computer, right click anywhere on the page for which you'd like to generate a code. In the dropdown menu, select "Create QR Code for this page." Click "Download" when QR Code image is displayed.
Once the code has been generated and saved as an image, insert the image into any document, like presentation slides, a research poster, or a flyer. Viewers will be able to scan the code with the camera app on their phone and be directed to the linked webpage.
Scroll down or click here for assignment ideas using this tool.
Omeka
Omeka is an open source, accessible platform for sharing digital collections. It allows multiple users to collaborate on a gallery project or create their own gallery individually. This tool has a bit of a learning curve and a lot of functions, so using this tool for an assignment will require some in-class lessons on how to use Omeka.
Features:
- website creation - the final product of using Omeka is a multimedia website
- galleries - users can compile and display galleries of images, text, and documents
- drawing connections - users make connections between gallery items (people, places, and things) by linking them to one another
- mapping - the geolocation feature is used for mapping and commenting on specific locations; map entries can be tied to gallery items
How to Use Omeka:
- Take a tour of Omeka here and watch the tutorial video for an introduction to using the platform.
Scroll down or click here for assignment ideas using this tool.
Multimodal Assignments Using Digital Tools
Interactive Annotated Bibliography (Litmaps)
During the research unit, assign an interactive annotated bibliography in place of a standard annotated bibliography:
- Ask students to use Litmaps to create a blank map and individually add each of their sources to the map. They may even use Litmaps to find sources by looking at the recommended, connected articles. In fact, it is recommended to encourage students to find some of their sources using the recommended connections, because this will show students how sources are actually "in conversation" with one another.
- Students can add notes to each source on their map. Ask them to write an annotation as a "note" for each source.
- Using this tool, students may want to include more than the minimum required number of sources on their map (because this tool makes it easy to find related sources). Consider allowing them to include as many sources as they'd like, but only requiring them to write annotations for 7-10 sources.
- Students can submit a Litmap by sending the instructor a link to their map. Students must make their map shareable and enable their notes (annotations) to be viewed by anyone with the link. The link can be copy-and-pasted into the textbox in your Brightspace assignment submission portal.
- Alternatively, you may ask students to submit by embedding their Litmap into their work-in-progress Google Site research portfolio and sharing the link to their Google Site with you. (See below for more on research portfolio websites.)
- Alternatively, you may ask students to submit by embedding their Litmap into their work-in-progress Google Site research portfolio and sharing the link to their Google Site with you. (See below for more on research portfolio websites.)
Research Portfolio Website (Google Sites)
You can use Google Sites to create a research portfolio in a number of ways. This is an example of one way to integrate multimodality and digital tools throughout the entire semester, culminating in a digital research portfolio:
- Unit 1 - learn how to use Litmaps when finding article for Scholarly Article Analysis
- Deliverable: “seed map” created in Litmaps (to complement analysis essay)
- Unit 2 - Use Litmaps in research process to find, document, and annotate sources
- Deliverable: interactive visual annotated bibliography
- Unit 3 - Use Google Sites to compile documentation of research process and results
- Deliverable: research portfolio website
Elements for Students to Include in the Research Portfolio Site:
- Research question
- Litmaps image + link to interactive annotated Litmap
- Research paper
- Gallery of images
- About the author (professional bio)
- Research narrative (reflective)
Click here for a Sample Research Portfolio created with Google Sites.
Remediation Project (Storyboardthat)
Students can use Storyboardthat to remediate one of their projects to be centered around visual storytelling:
- Greater emphasis on creative elements
- Can be a hybrid between a more traditional infographic/research poster
- Works especially well with the Rhetorics of Narrative theme
A few assignment ideas:
- Narrative storyboard - narrativize one or two elements of their argument
- "Dynamic" infographic - combine the genre of a storyboard with an infographic
- Script with visuals - add a more formal writing component to the storyboard
- ELI5 ("Explain it Like I'm 5") - inform a younger audience on a complex topic
On-Campus Research Sharing (QR Codes)
Give students the opportunity to showcase their multimedia project to a live Purdue audience. This project may work best for courses with a local Purdue or advocacy theme. Students can post a print flyer (with a QR code linking to a digital component with more information) in a location that they have rhetorically reflected upon.
Archive/Gallery (Omeka)
Students can create a digital archive with galleries, maps, images, text, and audio with this free software, making it the ultimate multimodal project tool. Explore the Omeka program yourself before deciding how to create an assignment using this software. You may assign group projects or even a shared project that the entire class contributes to.
Examples of Omeka projects:
Omeka has a wide range of users, from students to museum curators and academic DH project teams. Here are a few example sites created using Omeka--though keep in mind that individual student projects will not be nearly as robust.
- Artists, Patrons, and Japanese Art, a student group project created at Belmont University
- From farms to freeways: Women's memories of Western Sydney, a project created at University of Western Sydney
- DIY History, a project by the University of Iowa Digital Libraries
- Trans at the Table. Queer Oral Histories of Actual Play Podcast Fandoms, a digital thesis project created at Brown University
Traditional Multimodal Projects
Traditional multimodal projects include the infographic, research poster, podcast, and TEDTalk, each of which has a standard ICaP assignment template you can modify and use in your course. Find the assignment templates here.
Infographics
Programs for Creating Infographics:
- Piktochart
- a free online program for designing visual media including infographics. Their YouTube channel also provides helpful guides on the process of designing an infographic and how to use the Piktochart interface.
- Canva
- a free online program for designing visual media including infographics. Canva's Design School includes tutorials and video courses on various elements of design and how to use the site's tools. This page gives an overview of how to use Canva to create an infographic.
Resources for Learning about Data Visualization:
- SHARC - a free online tool teaching the SHARC approach (Scale, Hierarchy, Access, Readabliity, Color) to data visualization. This site focuses on creating charts students might use within their infographic. Students may explore this site on their own, or instructors may utilitize content for lesson plans.
Research Poster
Resources:
- Purdue OWL Guide to Research Posters
- Purdue Library Guide to Undergraduate Research Conference Posters
- ICaP Guide: How to Create a Research Poster Using PowerPoint
- ITaP Guide to Printing Research Posters
- Example Research Posters
Research Poster Templates: